Image Combination
Multiple images may be combined using the combine_images() function.
Combination Methods
The available methods for combination are passed into combine_images()
using the method parameter. Method may take one of the following values:
‘sum’ : Add all images together
‘median’ : (default) Return the median value over all images
‘mean’ : Return the (optionally weighted) mean value of all images.
Variance Propagation
If the variance of each image is known, it can be propagated through the combination operation and returned to the user as the combined variance of the combined image.
Variance is propagated as:
Method
Combined Variance
sum
\(\sum_{i=1}^{N}{V_i}\)
median
\(\frac{\pi}{2}.\sum_{i=1}^{N}{\frac{V_i}{N^2}}\)
mean
\(\sum_{i=1}^{N}{\frac{V_i}{N^2}}\)
mean (weighted)
\(\frac{1}{\sum_{i=1}^{N}{\frac{1}{V_i}}}\)
where \(V_i\) is the variance of image \(i\) out of \(N\) images.
If variance was not provided by the user, the variance may be as the variance of each pixel over all images:
where \(V_p\) is the variance reported for pixel \(p\), and I_{i, p}
is the value of pixel \(p\) in image \(i\).
Outlier Rejection
Outlier rejection may be enabled by setting robust=True. If enabled, outlier
rejection is handled by astropy.stats.sigma_clip(). The kwargs
parameter may be used to pass in any additional parameters such as threshold
and maxiters. However, the axis and masked parameters will be ignored.
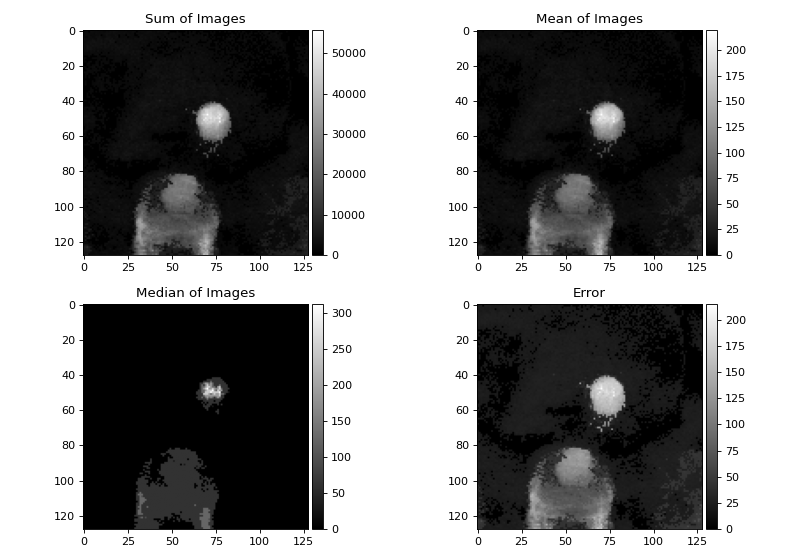
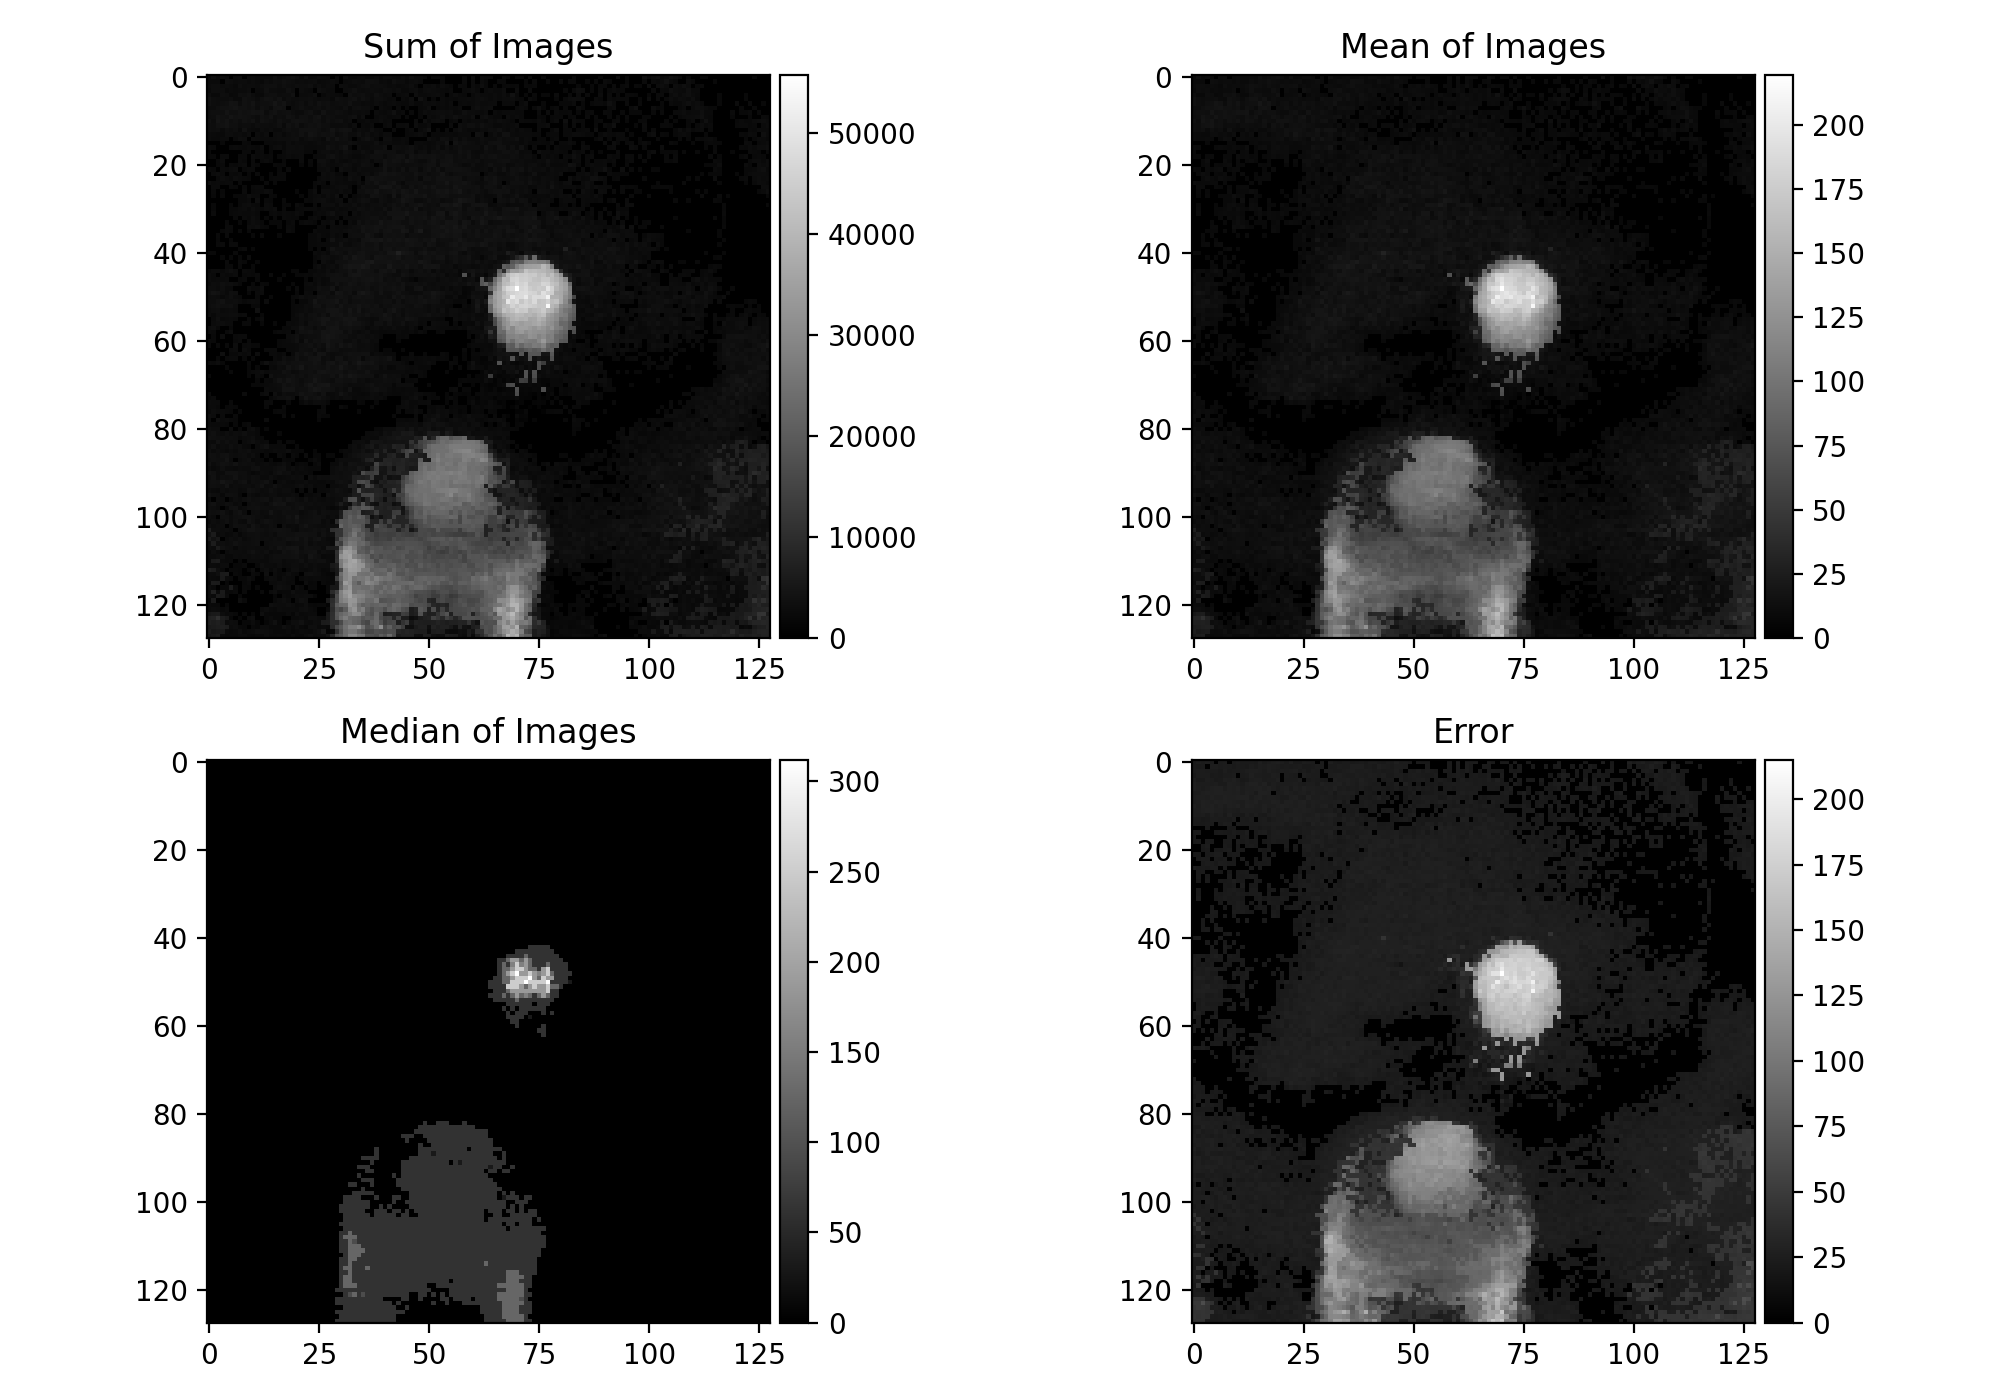
Example
The following example simply uses combine_images() to display the
sum, mean, median, and error of the combined frames of volumetric data.
import matplotlib.pyplot as plt
import imageio
import numpy as np
from sofia_redux.toolkit.image.combine import combine_images
from mpl_toolkits.axes_grid1 import make_axes_locatable

images = imageio.imread('imageio:stent.npz').astype(float)
sum_image, variance = combine_images(images, method='sum')
error = np.sqrt(variance)
mean_image = combine_images(images, method='mean', returned=False)
med_image = combine_images(images, method='median', returned=False)

fig, axs = plt.subplots(nrows=2, ncols=2, figsize=(10, 7))
titles = ['Sum of Images', 'Mean of Images', 'Median of Images', 'Error']
imgs = [sum_image, mean_image, med_image, error]
for i, (ax, img, title) in enumerate(zip(axs.flatten(), imgs, titles)):
    img2 = ax.imshow(img, cmap='gray')
    ax.set_title(title)
    divider = make_axes_locatable(ax)
    cax = divider.append_axes("right", size="5%", pad=0.05)
    fig.colorbar(img2, cax=cax)

plt.tight_layout()
(Source code, png, hires.png, pdf)
