The Spline class
The Spline object derives a spline representation on initialization and may then be used to evaluate that spline using the call method.
Basic Usage Example
In this example, we create an interpolating spline to represent a sine function and check that the evaluation of the spline gives reasonable results.
import numpy as np
from sofia_redux.toolkit.splines.spline import Spline

# Create a continuous function
x = np.linspace(0, 2 * np.pi, 100)
y = np.sin(x)

# initialize an interpolating spline of degree 3.
spline = Spline(x, y, degrees=3, smoothing=0)

# Check the spline evalutations
assert np.isclose(spline(np.pi), 0, atol=1e-6)
assert np.isclose(spline(np.pi / 2), 1, atol=1e-6)
assert np.allclose(spline(x), y)
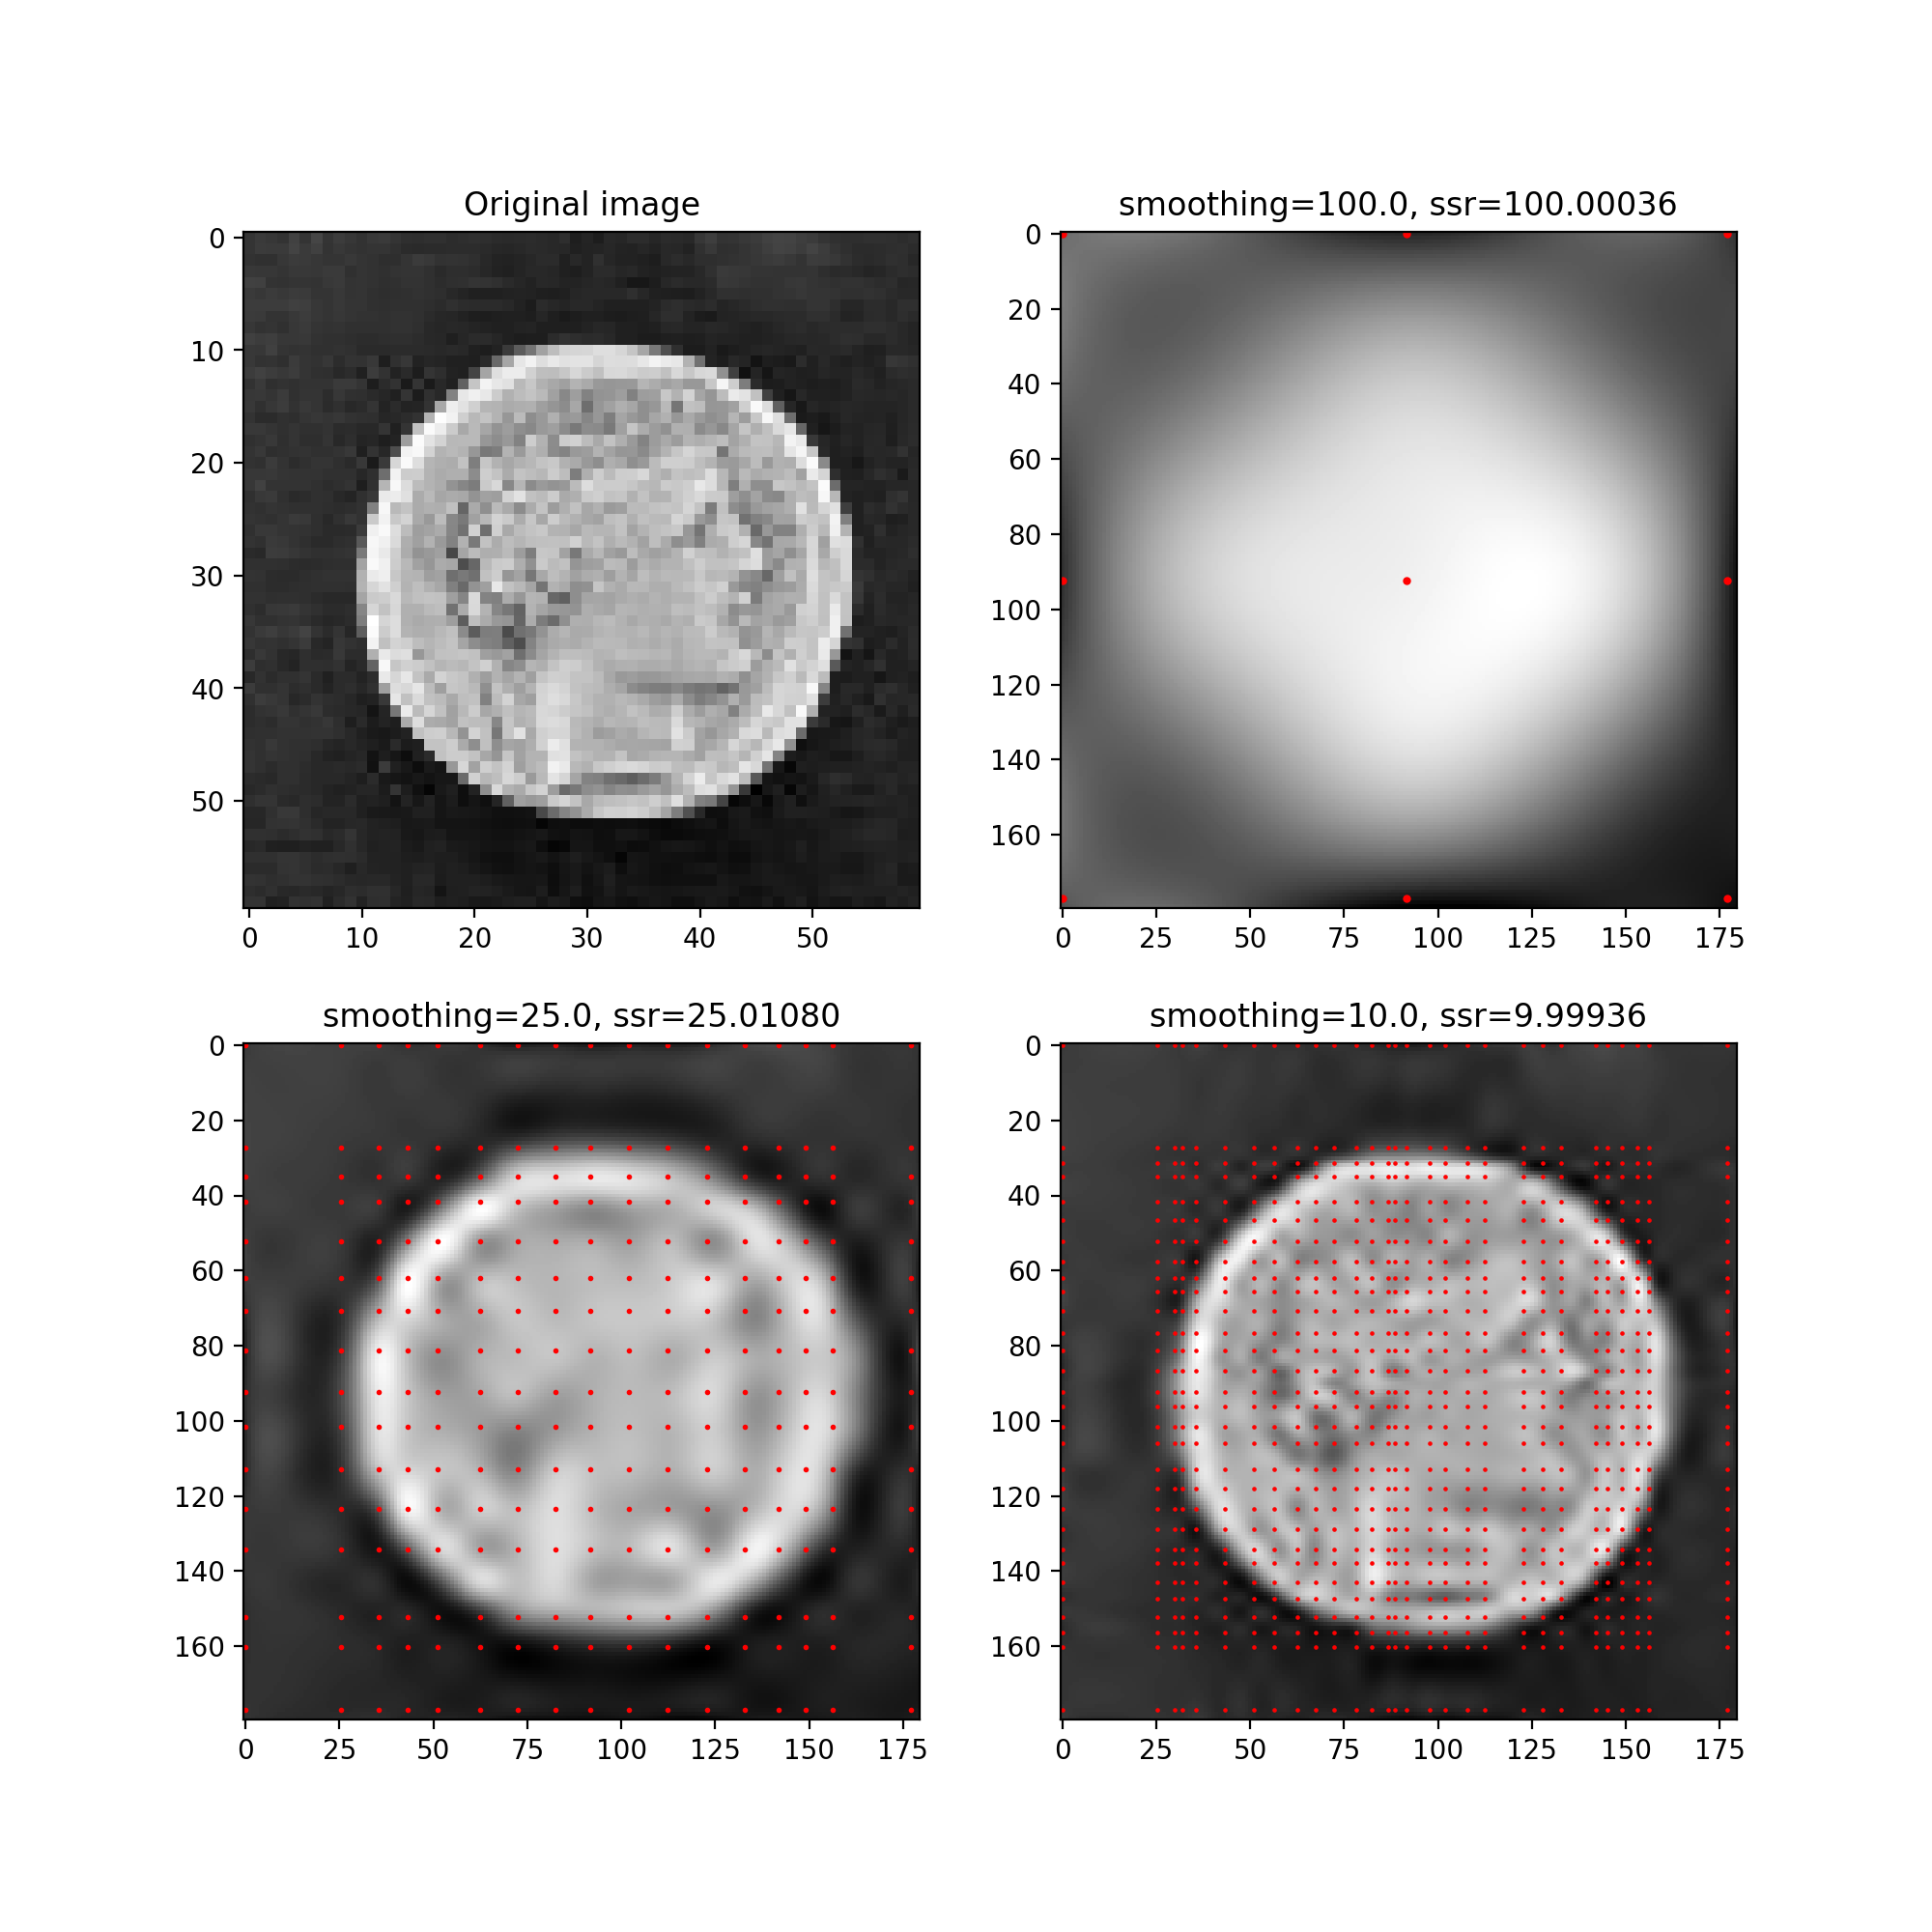
Fitting noisy data
In the following example we generate three 3rd degree spline fits to a noisy image with different smoothing parameters. The red dots mark the location of the knots, and the various smoothing parameters and resulting sum of the residuals squared (ssr) are displayed. Note that if a regular grid of data values are passed into the Spline, the coordinates are inferred from the shape of the data where the spacing between each point is set to 1.
import numpy as np
import matplotlib.pyplot as plt
import imageio
from sofia_redux.toolkit.splines.spline import Spline

image = imageio.imread('imageio:coins.png')
noisy_image = image[165:225,70:130].astype(float)
noisy_image -= noisy_image.min()
noisy_image /= noisy_image.max()

# Create spline representations of the image at different smoothing levels
splines = []
for smoothing in [100, 25, 10]:
    splines.append(Spline(noisy_image, degrees=3, smoothing=smoothing))

# Create a finer grid
ny, nx = noisy_image.shape
x = np.linspace(0, nx - 1, nx * 3)
y = np.linspace(0, ny - 1, ny * 3)

fig, ((ax1, ax2), (ax3, ax4)) = plt.subplots(2, 2, figsize=(10, 10))
ax1.imshow(noisy_image, cmap='gray')
ax1.set_title('Original image')

for i, axis in enumerate([ax2, ax3, ax4]):
    axis.imshow(splines[i](x, y), cmap='gray')
    axis.set_title(f'smoothing={splines[i].smoothing}, '
                   f'ssr=%.5f' % splines[i].sum_square_residual)
    kx = np.unique(splines[i].knots[0][:splines[i].n_knots[0]]) * 3
    ky = np.unique(splines[i].knots[1][:splines[i].n_knots[1]]) * 3
    kg = np.meshgrid(kx, ky)
    ky, kx = kg[0].ravel(), kg[1].ravel()
    axis.plot(kx, ky, '.', color='r', markersize=4 / (i + 1))
(Source code, png, hires.png, pdf)
